2-7: Source Code Debugging
In this section, our attention is drawn towards debugging a few tools such as Gradle, Android Gradle Plugin (AGP), Annotation Processor, and others. We will cover obtaining source code and the techniques for attaching a debugger.
For source code used in the sub-section "Debugging Custom Scripts and Plugins", please refer to the debug-tips project.
2-7-1: Debugging Gradle
Starting with Gradle's source code, accessing its code base is quite straightforward since it's an open-source project hosted on Github:
# e.g. For version 6.8.2, clone the project and switch to the Tag 6.8.2
$ git clone [email protected]:gradle/gradle.git
$ git checkout tags/v6.8.2 -b temp-6.8.2
Naturally, before delving into debugging, we must ensure that the project (hereafter referred to as project P) built by Gradle is of the same version as the one participating in the debugging.
# /project/gradle/wrapper/gradle-wrapper.properties
distributionUrl=.../gradle-6.8.2-all.zip
Once the version match is confirmed, initiate the compilation of Project P:
$ ./gradlew clean assembleDebug -Dorg.gradle.debug=true --no-daemonNote the following details:
-Dorg.gradle.debug=truetriggers the Debug mode of Gradle, causing Gradle to pause and await the Debugger's attachment. This parameter is equivalent to-agentlib:jdwp=transport=dt_socket,server=y,suspend=y,address=5005, where JDWP stands for Java Debug Wire Protocol, which facilitates communication between the Java debugger and the virtual machine.--no-daemoninitiates a non-daemon mode, which prevents reusing the active Gradle Daemon in the system, but rather creates a fresh Gradle container to avoid potential compilation environment issues.
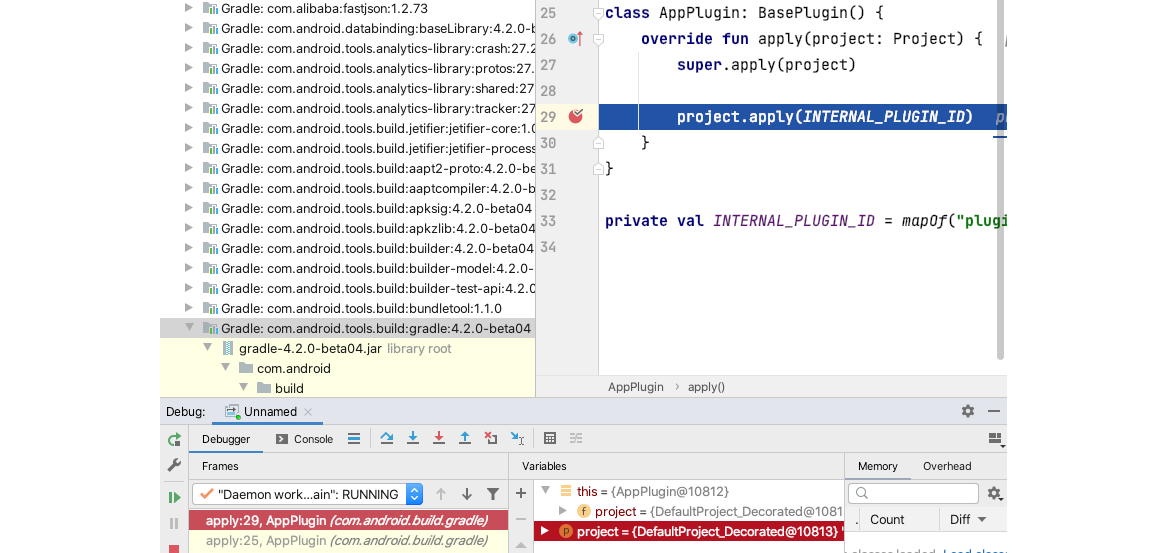
After placing project P in the "waiting-for-debugger" state, we can have Android Studio or IDEA open the Gradle source code project and configure the remote debugger by following these steps:
- In the drop-down menu of Run/Debug Configuration, select Edit Configurations. (Figure 2.7.1)

- In the dialogue that appears, click on the "+" sign in the top left corner to add the running configuration of Remote JVM Debug. The default configuration generated should meet our Debug requirements. (Figure 2.7.2)
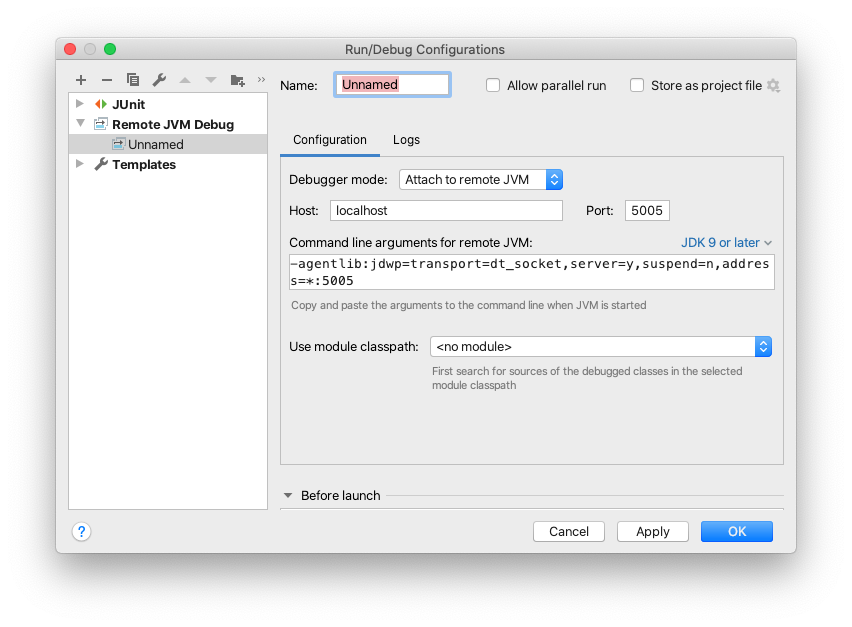
- Lastly, click on the Debug button in the IDE to attach to project P for debugging. (Figure 2.7.3)

2-7-2: Debugging Android Gradle Plugin (AGP)
When debugging the Android Gradle Plugin (AGP), two common approaches come into play: inspecting the source code or the sources.jar.
Using Source Code
Retrieving the AGP source code is more intricate than with Gradle. However, the source code provides high operability as it permits debugging and compiling your own version. In fact, some companies do maintain their custom Gradles. AGP's source code is stored in the Google Repository, with version tags denoted as gradle_a.b.c. But:
- Not all versions have tags, for instance, most minor version alterations don't have corresponding Tags (3.3.1, 3.3.2, etc.).
- The gradle_a.b.c tag was discontinued after 3.4.0, and the AGP DSL Reference also stopped at 3.4.0, moving to the Android Developer Document after 4.1.0.
Given that AGP and AS versions 4.2 and below are version-synced (the source code is also in the same repository), the tag studio-a.b.c can be used to locate the corresponding AGP source code. The subsequent operations are based on the studio-4.1.1 branch, which can be confirmed by referring to the following:
- The version number "4.1.1" can be double-checked in /AGP/tools/buildSrc/base/version.properties, and /AGP/tools/base/build-system/gradle-core/build.gradle is associated with this version.
- The primary code resides in /AGP/tools/base/build-system/gradle-core and /AGP/tools/base/build-system/gradle-api. Based on the dependency declaration, the core dependency is the package in /AGP/tools.
As a note, there is no Studio branch corresponding to versions 3.5.0 and 3.6.0, and at the time of writing, no solutions have been found for this issue. However, from version 7.0.0 onwards, the updated version number format for Android Studio, such as 2021.1.1, should be used for reference purposes, thus, the branch name will be studio-2021.1.1.
The process of obtaining the source code bears similarities to pulling the Android Open Source Project (AOSP) source code. As outlined in Google's Android Gradle Plugin documentation, you first need to install the Repo, a Git management tool. Subsequently, use the following command to clone the corresponding repository (which includes multiple projects) to your local system:
# Assume the clone directory is /AGP
repo init -u https://android.googlesource.com/platform/manifest \
  -b studio-4.1.1
repo sync
Following the successful execution of the sync command, the remaining debugging procedures are identical to the Gradle ones. Both AS and IntelliJ IDEA debuggers support the attachment of multiple source code projects simultaneously.
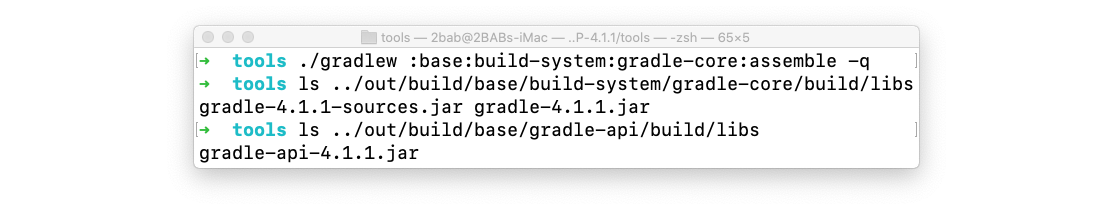
If you aim to alter and produce a custom AGP Plugin, you can compile it in the /AGP/tools directory with ./gradlew :base:build-system:gradle-core:assemble. This will include gradle-api along with other projects, and the output directory will be /AGP/out/build. (Figure 2.7.4)
Using sources.jar
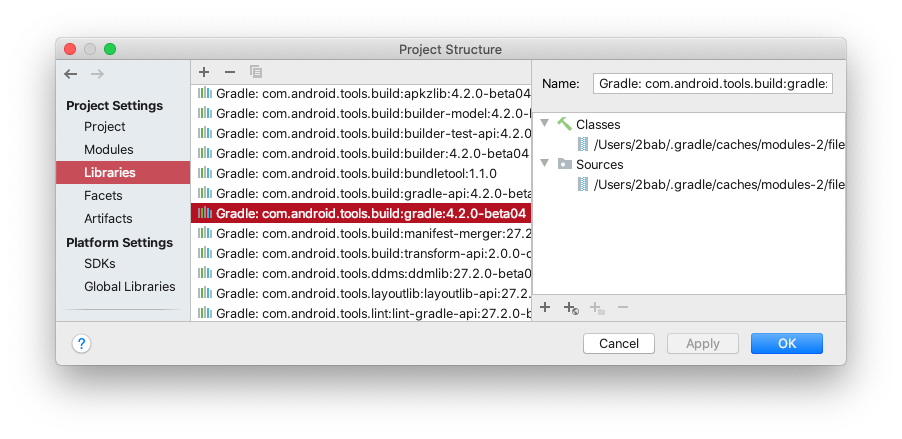
Often, you'll notice open-source projects on GitHub releasing source-code.zip or sources.jar on their Releases page. This is also the case for the AGP releases, which come with a sources.jar. If you are currently writing a Plugin and have included implementation("com.android.tools.build:gradle:4.2.0-beta04") in the dependencies, you should be able to view the following information in IntelliJ IDEA's Project Structure panel (Figure 2.7.5):
Among the packages, ./gradle-4.2.0-beta04.jar under Classes category is included in the final compilation, while ./gradle-4.2.0-beta04-sources.jar under Sources serves a referencing purpose. For instance, code accessed from the left External Libraries menu is fetched from Sources, when available. (Figure 2.7.6)
Utilizing the IDE's Debugger, you can Attach the source code under the relevant sources, enabling developers to debug external dependencies with minimal effort. This feature is beneficial for source code tracing and retrieving necessary information in more than 90% of cases.
2-7-3: Debugging AAPT2 and D8/R8
AGP has numerous external build dependencies, which we have verified when manually constructing the APK in Section 1-4. Here we take AAPT2 and D8/R8 as examples, to briefly discuss debugging and version alteration of external dependencies.
AAPT2
The source code for AAPT2 is bundled with AOSP and can be synchronized from the Google Source or cloned from Github's aosp-mirror. The compilation process closely follows that of AOSP, and by far the current tested version (2.19) still uses MAKEFILE.
The compilation result of AAPT2 is an executable file, and it's crucial to link it to the existing AGP. One method is to modify the AGP source code, then use the locally-modified AGP and AAPT2 when packaging. Although this adjustment is flexible, the actual steps involved can be quite complex.
For debugging AAPT2 without having to recompile your own AGP, consider this simpler alternative: Set a breakpoint at the location where the external command of AAPT2 is about to be executed, then use the Expression Evaluate tool of the IDE to replace the execution body of the command with your compiled AAPT2. (Figure 2.7.7)
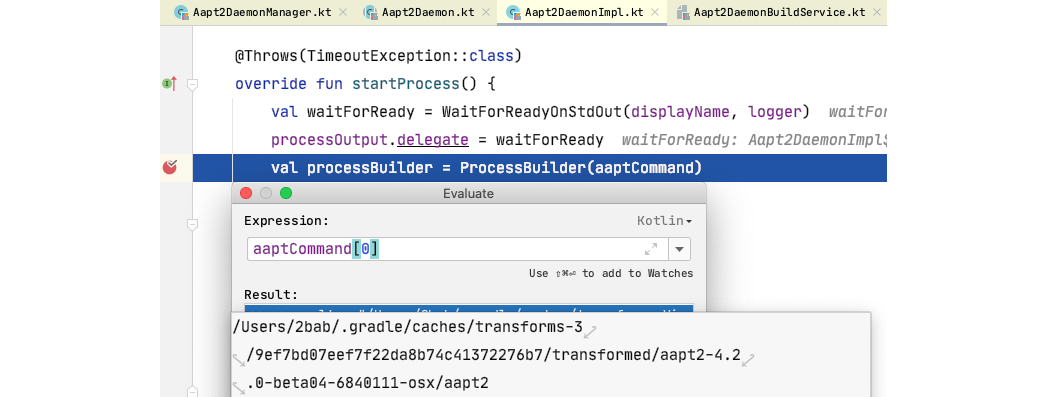
Specifically, after constructing the ProcessBuilder based on the built-in AAPT2, carry out an extra run with the Expression Evaluate:
processBuilder.command(listOf("myaapt2", "m"))By doing this, you can easily switch the executable file of AAPT2 to your own compiled version. As AAPT2 is written in C++, you can refer to tools such as GDB or LLDB for its debugging.
D8/R8
The source code for D8/R8 is housed in a separate repository and can be directly cloned using the git clone command. However, to compile D8/R8, the depot_tools package from Chromium is required. This package can be cloned from another repository and added to your local environment variables by following the guide Checking out and building Chromium for Mac. Once prepared, you can execute the following command in the D8/R8 directory:
./tools/gradle.py d8 r8This compiles D8/R8 and outputs the result to ./build/libs/. However, debugging D8/R8 cannot rely on the approach that we used for AAPT2, since D8/R8 does not execute via external command-line mode. AGP comes with a pre-compiled D8/R8, visible when inspecting the contents of com.android.tools.build:builder:4.2.0 (Figure 2.7.8).
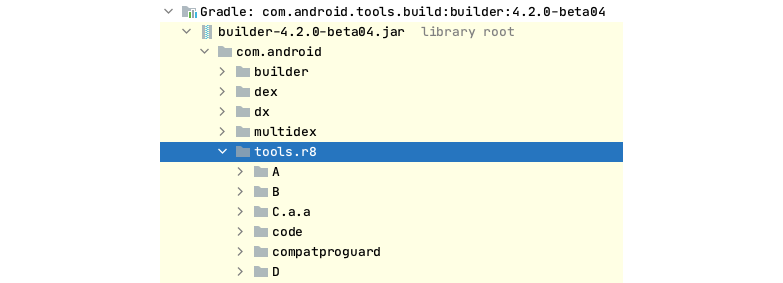
However, you can't directly link your downloaded source code through remote attach. Upon close examination, it's clear that aside from the public API, the rest of the prebuilt tools.r8 package's code is obfuscated. This makes debugging impossible, as the code is untraceable.
The solution comes in two forms: firstly, AGP can be compiled locally, replacing r8.jar package with your compiled version; secondly, Gradle dependency arbitration can be utilized by adding your compiled r8.jar to any dependency that declares com.android.tools.build:gradle:4.2.0 (i.e., AGP) at the forefront to give a higher priority for Gradle to choose our r8.jar. This is typically done in:
- The root of the project's build.gradle(.kts).
- The project's buildSrc.
It ensures that during the AGP compilation process, the relevant D8/R8 classes will target your compiled version instead of the pre-compiled r8.jar in the AGP's builder package. Hence, we can attach the debugger to the D8/R8 source code. (Figure 2.7.9)

2-7-4: Debugging Annotation Processor / KAPT / KSP
Annotation Processors on Android projects have three typical compilers, each with their respective debugging methods:
- The AGP's
annotationProcessorconfiguration: This follows the same process as Gradle Debugging (the JVM Remote Debug). - Kapt: Since the Kapt Compiler runs in a separate process from AGP and Gradle by default, two additional parameters (passed by
-D) are required to instruct it to run in the current process and to enable debug mode (the same as Gradle).
./gradlew clean assembleDebug --rerun-tasks -Dorg.gradle.debug=true \
  --no-daemon -Dkotlin.compiler.execution.strategy="in-process" \
  -Dkotlin.daemon.jvm.options=\
"-Xdebug,-Xrunjdwp:transport=dt_socket\,address=5005\,server=y\,suspend=n"- KSP: It also requires additional parameters (passed by
-Dand-P) to run in the Gradle process, but the adaptation isn't perfect enough (due to waiting for Kotlin Daemon). In my personal project, it may take up to 3-4 minutes to hit the breakpoint of the processor entrance, and the status of the related issue remains open at the time of writing this guide.
./gradlew clean assembleDebug --rerun-tasks -Dorg.gradle.debug=true \
  --no-daemon -Pkotlin.compiler.execution.strategy="in-process" \
  -Dkotlin.daemon.jvm.options=\
  "-Xdebug,-Xrunjdwp:transport=dt_socket\,address=5005\,server=y\,suspend=n"
Note that the in-process parameter passing of Kapt and KSP is different. -D stands for system environment parameters, and -P is for Gradle Project parameters. Kotlin has deprecated the -D version of the compiler.execution.strategy, and while the impact on Kapt is unknown.
Besides that, the legacy apt compiler (a third party tool) is not in our discussion here.
2-7-5: Debugging Custom Scripts and Plugins
When we work on custom Gradle scripts and Plugins, debugging is also often required. For custom Binary Plugins, both independent Plugin projects and Plugins in buildSrc offer good debugging support, and the debugging steps do not differ from those used in previous Gradle and AGP debugging. For custom Script Plugins and basic Gradle scripts, whether they are build.gradle.kts or other *.gradle.kts, there are some problems. You can refer to the Playground's debug-tips/ module to observe the following issues.
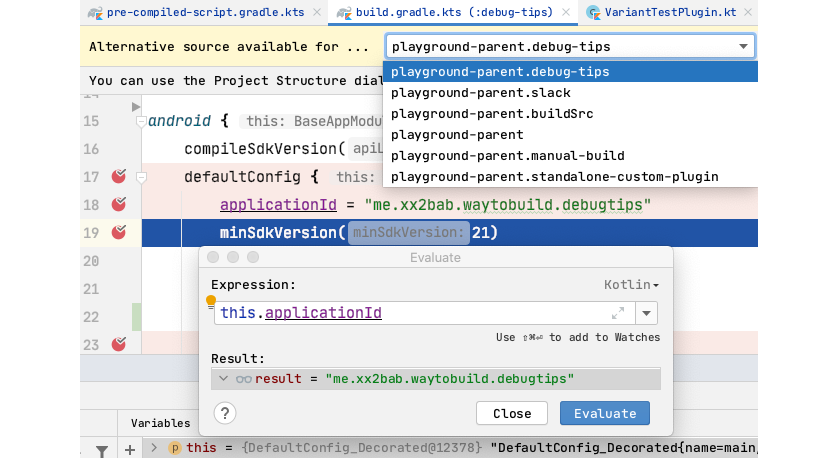
The first issue, which I call "breakpoint drift", occurs when debugging the identically named build.gradle.kts . If the current project has multiple modules, you might experience the breakpoint being hit but the current highlight area pointing to an unrelated file. To resolve this, manually specify the exact script source, for example, using the drop-down menu as shown in Figure 2.7.10. The decision criteria are the context information for the this object in the current Debug-Variables panel. For example, if the this object points to DefaultConfig, and a breakpoint was added to a specific module's defaultConfig {}, choose the build script of that module, e.g. we find the debug-tips module by the application id debugtips.
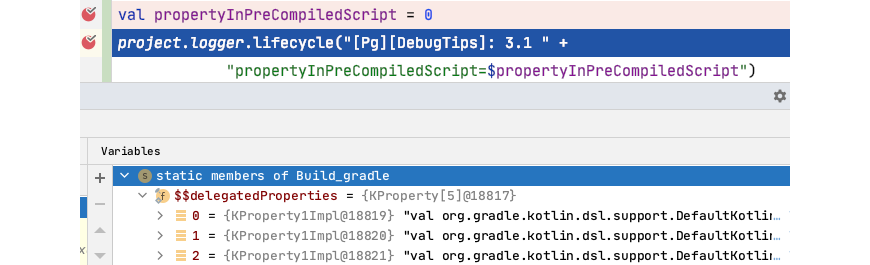
The second issue arises when the variables and methods are defined at the root of the script. They can be correctly suspended by breakpoints, but context information cannot be obtained at that time, and you cannot see any useful information from the Variables panel. The calculation of the propertyInPreCompiledScript expression in Expression Evaluate is also erroneous. (Figure 2.7.11)
2-7-6: In Summary
In this section, we covered not just the debugging of Gradle Plugins, but also took a deep dive into Gradle, AGP, and related tools. Given that some of the Gradle and AGP APIs lack detailed documentation and cases, it's recommended to debug the source code when necessary, utilizing the tools in the Expression Evaluate panel to make Plugins debugging more convenient.